Results
The greatest growth was seen in Early Years students i.e. Reception to Year 2. This is due to the depth of early teaching provided on the foundations of number – Trusting the Count. Older students needed to revisit those foundational areas prior to moving on to more age / year level appropriate learning. However we still noted growth in these students’ number knowledge.
The below PAT Maths analysis is for students from Noarlunga Downs P-7 School:
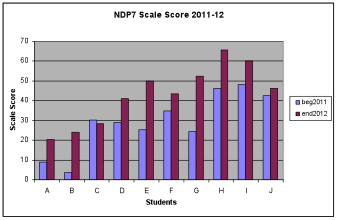
Fifteen Aboriginal and Torres Strait Islander students contributed to the data collection at Noarlunga Downs P-7 School. The nine students that completed the same PAT Maths test at the start of 2012 and the end of Term 3, 2012 showed an average growth of 17 percentile points and an average growth of 6.58 in the Scale score. Five of the remaining students needed to be tested on a higher level in Term 3 than at the start of the year in line with our assessment protocols. This means that students who achieve Stanines 1-3 need to sit a lower test, students who achieve Stanines 4-6 are at that test’s level and students who achieve Stanines 7-9 sit a higher test. The remaining student made no progress.
| Start 2012 | End 2012 | ||||||||||
| Year Level | Test | Test Score | Scale Score | Stanine | %ile | Test | Test Score | Scale Score | Stanine | %ile | |
| E* | 1 | 1 | 16 | 23.9 | 6 | 68 | 2 | 13 | 18 | 5 | 46 |
| R* | 1 | 1 | 13 | 14.4 | 4 | 32 | 2 | 15 | 22.9 | 6 | 65 |
| C | 4 | 2 | 19 | 35.6 | 5 | 56 | 3 | 20 | 40.9 | 6 | 75 |
| T | 5 | 2 | 20 | 40.6 | 6 | 74 | 3 | 18 | 36.5 | 3 | 19 |
| K | 6 | 4 | 29 | 61 | 6 | 69 | 5 | 17 | 44.8 | 3 | 13 |
*Students who are working above their Year level.
PAT Maths – Change in scale score
NAPLAN results (Noarlunga Downs P-7 School)
The NAPLAN growth shown is for the students at Noarlunga Downs P-7 School as data from other cluster sites is still being collated. More data will be provided as it comes to hand.
| Growth 2008-10 | Growth 2010-12 | Growth 2008-12 | |||
| Score | Band | Score | Band | Score | Band |
| 44.2 | 0.7 | 42.7 | 0.8 | 98.2 | 1.7 |
(Average Growth)
| Growth 2009-11 | |
| Score | Band |
| 30.14 | 0.4 |
(Average Growth)
The PAT Maths analysis below is for students from Christies Beach Primary School:
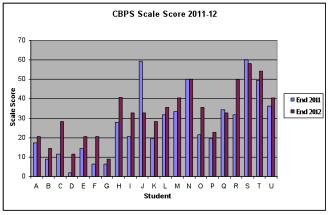
Thirty Aboriginal and Torres Strait Islander students contributed to the data collection at Christies Beach Primary School. The eight students that completed the same PAT Maths test at the end of 2011 and the end of Term 3, 2012 showed an average growth of 5 percentile points and an average growth of 2.11 in the Scale score. Four of the remaining students needed to be tested on a higher level in Term 3 than at the end of 2011 in line with our assessment protocols. This means that students who achieve Stanines 1-3 need to sit a lower test, students who achieve Stanines 4-6 are at that test’s level and students who achieve Stanines 7-9 sit a higher test. Nine of the students had not previously sat the test. The remaining nine students sat a lower test in 2012 than they had in 2011.
PAT Maths – Change in scale score
The growth in teacher effectiveness is not measureable in an empirical sense but we have seen an embedding of scaffolding pedagogy in many of the teachers involved in the Make It Count project. We have also witnessed an increase in Mathematical content knowledge in both teachers and support staff. This has alleviated some staff’s fear and dislike of Mathematics by building their confidence and understanding. Pedagogical and content knowledge growth was noted through regular observations of lessons by site leaders, peers and visitors to the sites. Observations were recorded on an observation pro forma designed as part of the project, discussed and shared in a 30 minute feedback session. This supports the ongoing practice of backward planning.
After the most recent observations leadership at Noarlunga Downs P-7 School prepared some 'generic' feedback to share with staff. We see a narrowed focus because of the specific learning goal. As a result ongoing assessment is more specific. Click here for feedback tool.


