> S_A_AP1_S5_fig1


Media / TDT / Statistics / S_A_AP1_S5_fig1

S_A_AP1_S5_fig1
« 
Previous image
|
|
Next image
 »

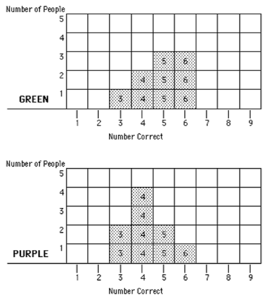
Two plots, one labelled 'Green' with values of 3, 4, 4, 5, 5, 5, 6, 6 and 6. The other plot is labelled 'Purple' with values of 3, 3, 4, 4, 4, 4, 5, 5 and 6.

Plots of mathematics scores for 9 students in two different classes.

Related content

S_A_AP1_S6_...

S_A_AP1_S4_...

S_A_AP1_S4_...

S_A_AP1_S2_...