> S_CM_M4_E2_fig2


Media / TDT / Statistics / S_CM_M4_E2_fig2

S_CM_M4_E2_fig2
« 
Previous image
|
|
Next image
 »

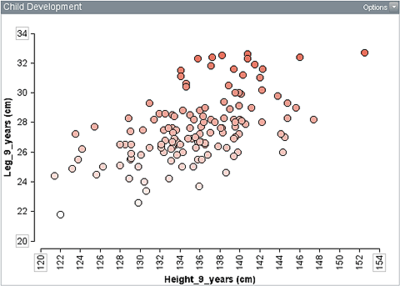
Scatterplot with height on the horizontal axis and leg length on the vertical axis, values rise from lower left to upper right, moderately spread.

Association of height and leg length for a second group of 136 nine-year-olds.

Related content

S_CM_M4_A1_...

S_CM_M4_A1_...

S_CM_M4_A1_...

S_CM_M4_A3_...

S_CM_M4_E2_...

S_CM_M4_E2_...