> S_GT_T1_E2_A3_fig1


Media / TDT / Statistics / S_GT_T1_E2_A3_fig1

S_GT_T1_E2_A3_fig1
« 
Previous image
|
|
Next image
 »

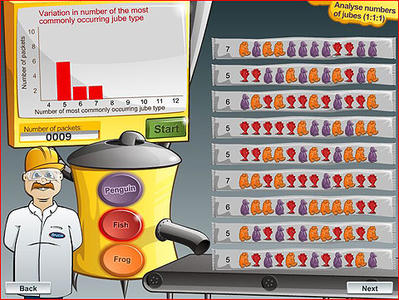
Nine packets of jubes with maximum number of jubes of one colour in each packet identified. Column graph of the information showing five as the most commonly occurring.

Screen grab from L3655 Random or not: analyse numbers of jubes (1:1:1).
Source: © Education Services Australia Ltd, 2011

Related content